Find out where the network fails before it does.
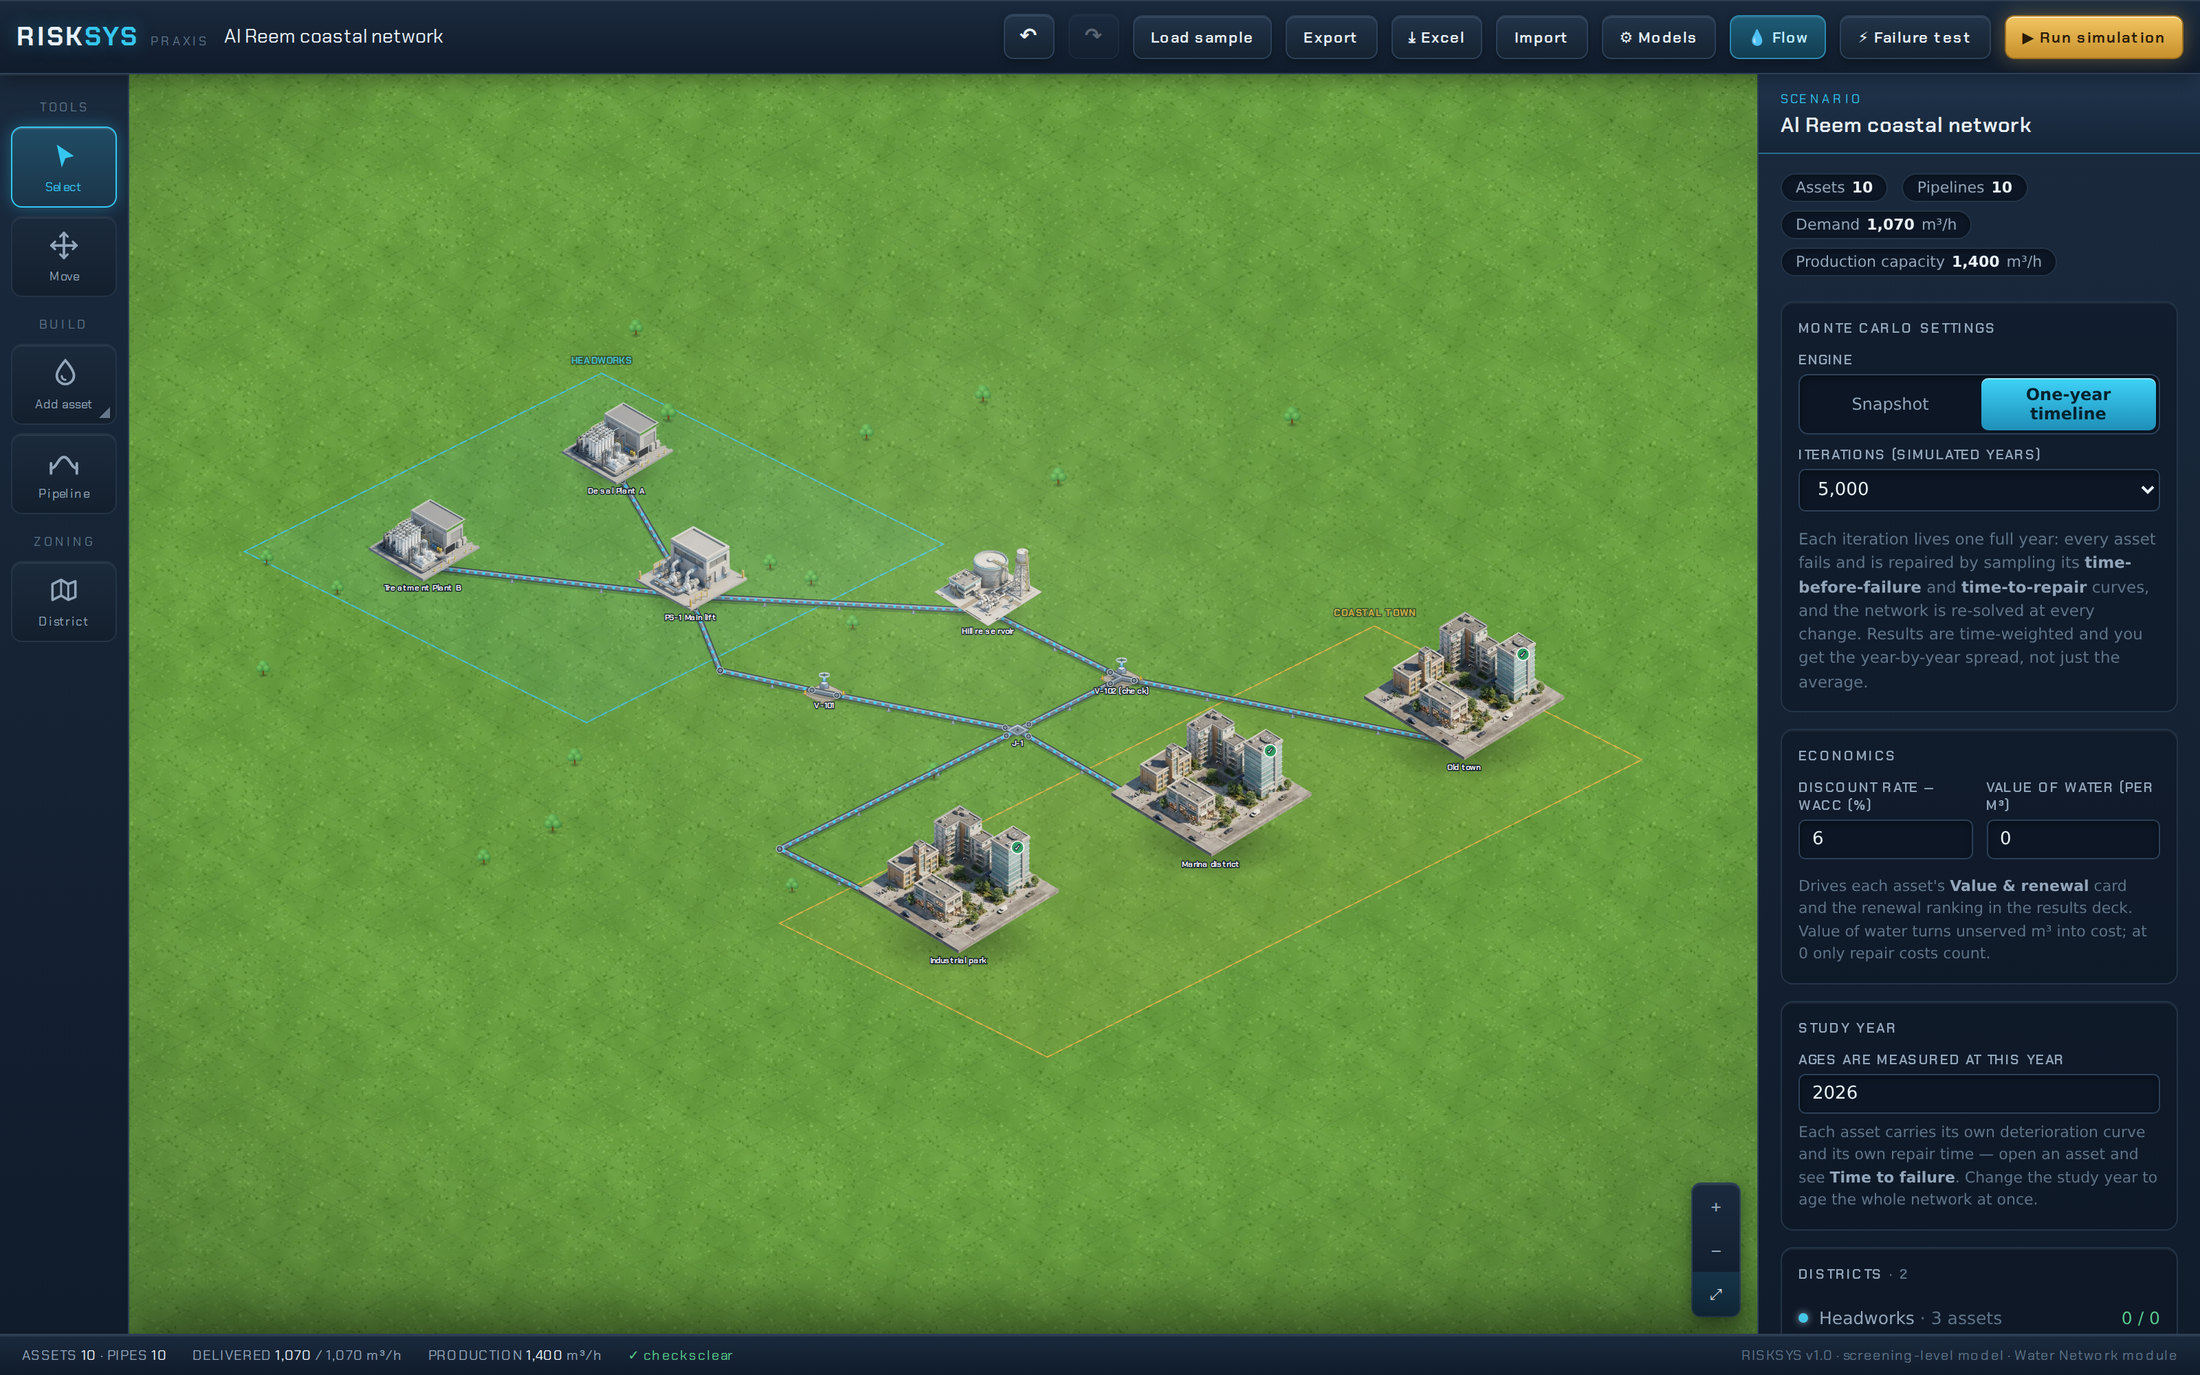
RISKSYS is a network reliability studio. You draw the network the way it is actually built, tell it how each asset ages, fails and gets repaired, and it simulates thousands of years of operation to find which customers lose supply, how often, and which single asset is doing most of the damage.
It runs in a browser with nothing to install. The current release covers water transmission and distribution: production plants, pumping stations, storage, valves and demand zones.
Which asset actually matters.
Most criticality registers are filled in by hand. An engineer scores each asset one to five on consequence and likelihood, the scores are multiplied, and the result decides where the maintenance budget goes. It is a reasonable way to start and a poor way to finish, because it asks about assets one at a time and a network does not fail one asset at a time.
A duplicated pump that scores high on its own may not matter at all. A small valve that scores low may be the one thing standing between a district and a dry morning. The difference is not in the asset, it is in where the asset sits and what else can carry the water when it goes.
RISKSYS works the other way round. It knocks each component out in turn, re-solves the whole network, and measures what that actually costs in water not delivered. Criticality comes out of the model rather than going into it.
Four steps, in the browser.
A first network takes an afternoon. There is no import project, no server and no licence server to talk to.
Build
Place production plants, pumping stations, storage tanks, valves, junctions and demand zones on the ground. Draw districts over the top when you want to read the network by area.
Connect
Lay the mains between them. Each pipeline carries its diameter, material, joint type, length and installation year, because those are what set how often it breaks and how long it takes to fix.
Configure
Set duty and standby pumps, heads and flows, valve direction, demand and its priority. Give each asset a deterioration curve and a repair time, or apply one from the model library.
Simulate
Run the Monte Carlo. Every iteration lives a full year: assets fail and are repaired on their own curves, and the network is re-solved at every change.
What comes out of a run.
Not a heat map of colours. Numbers with units, and the working behind them.
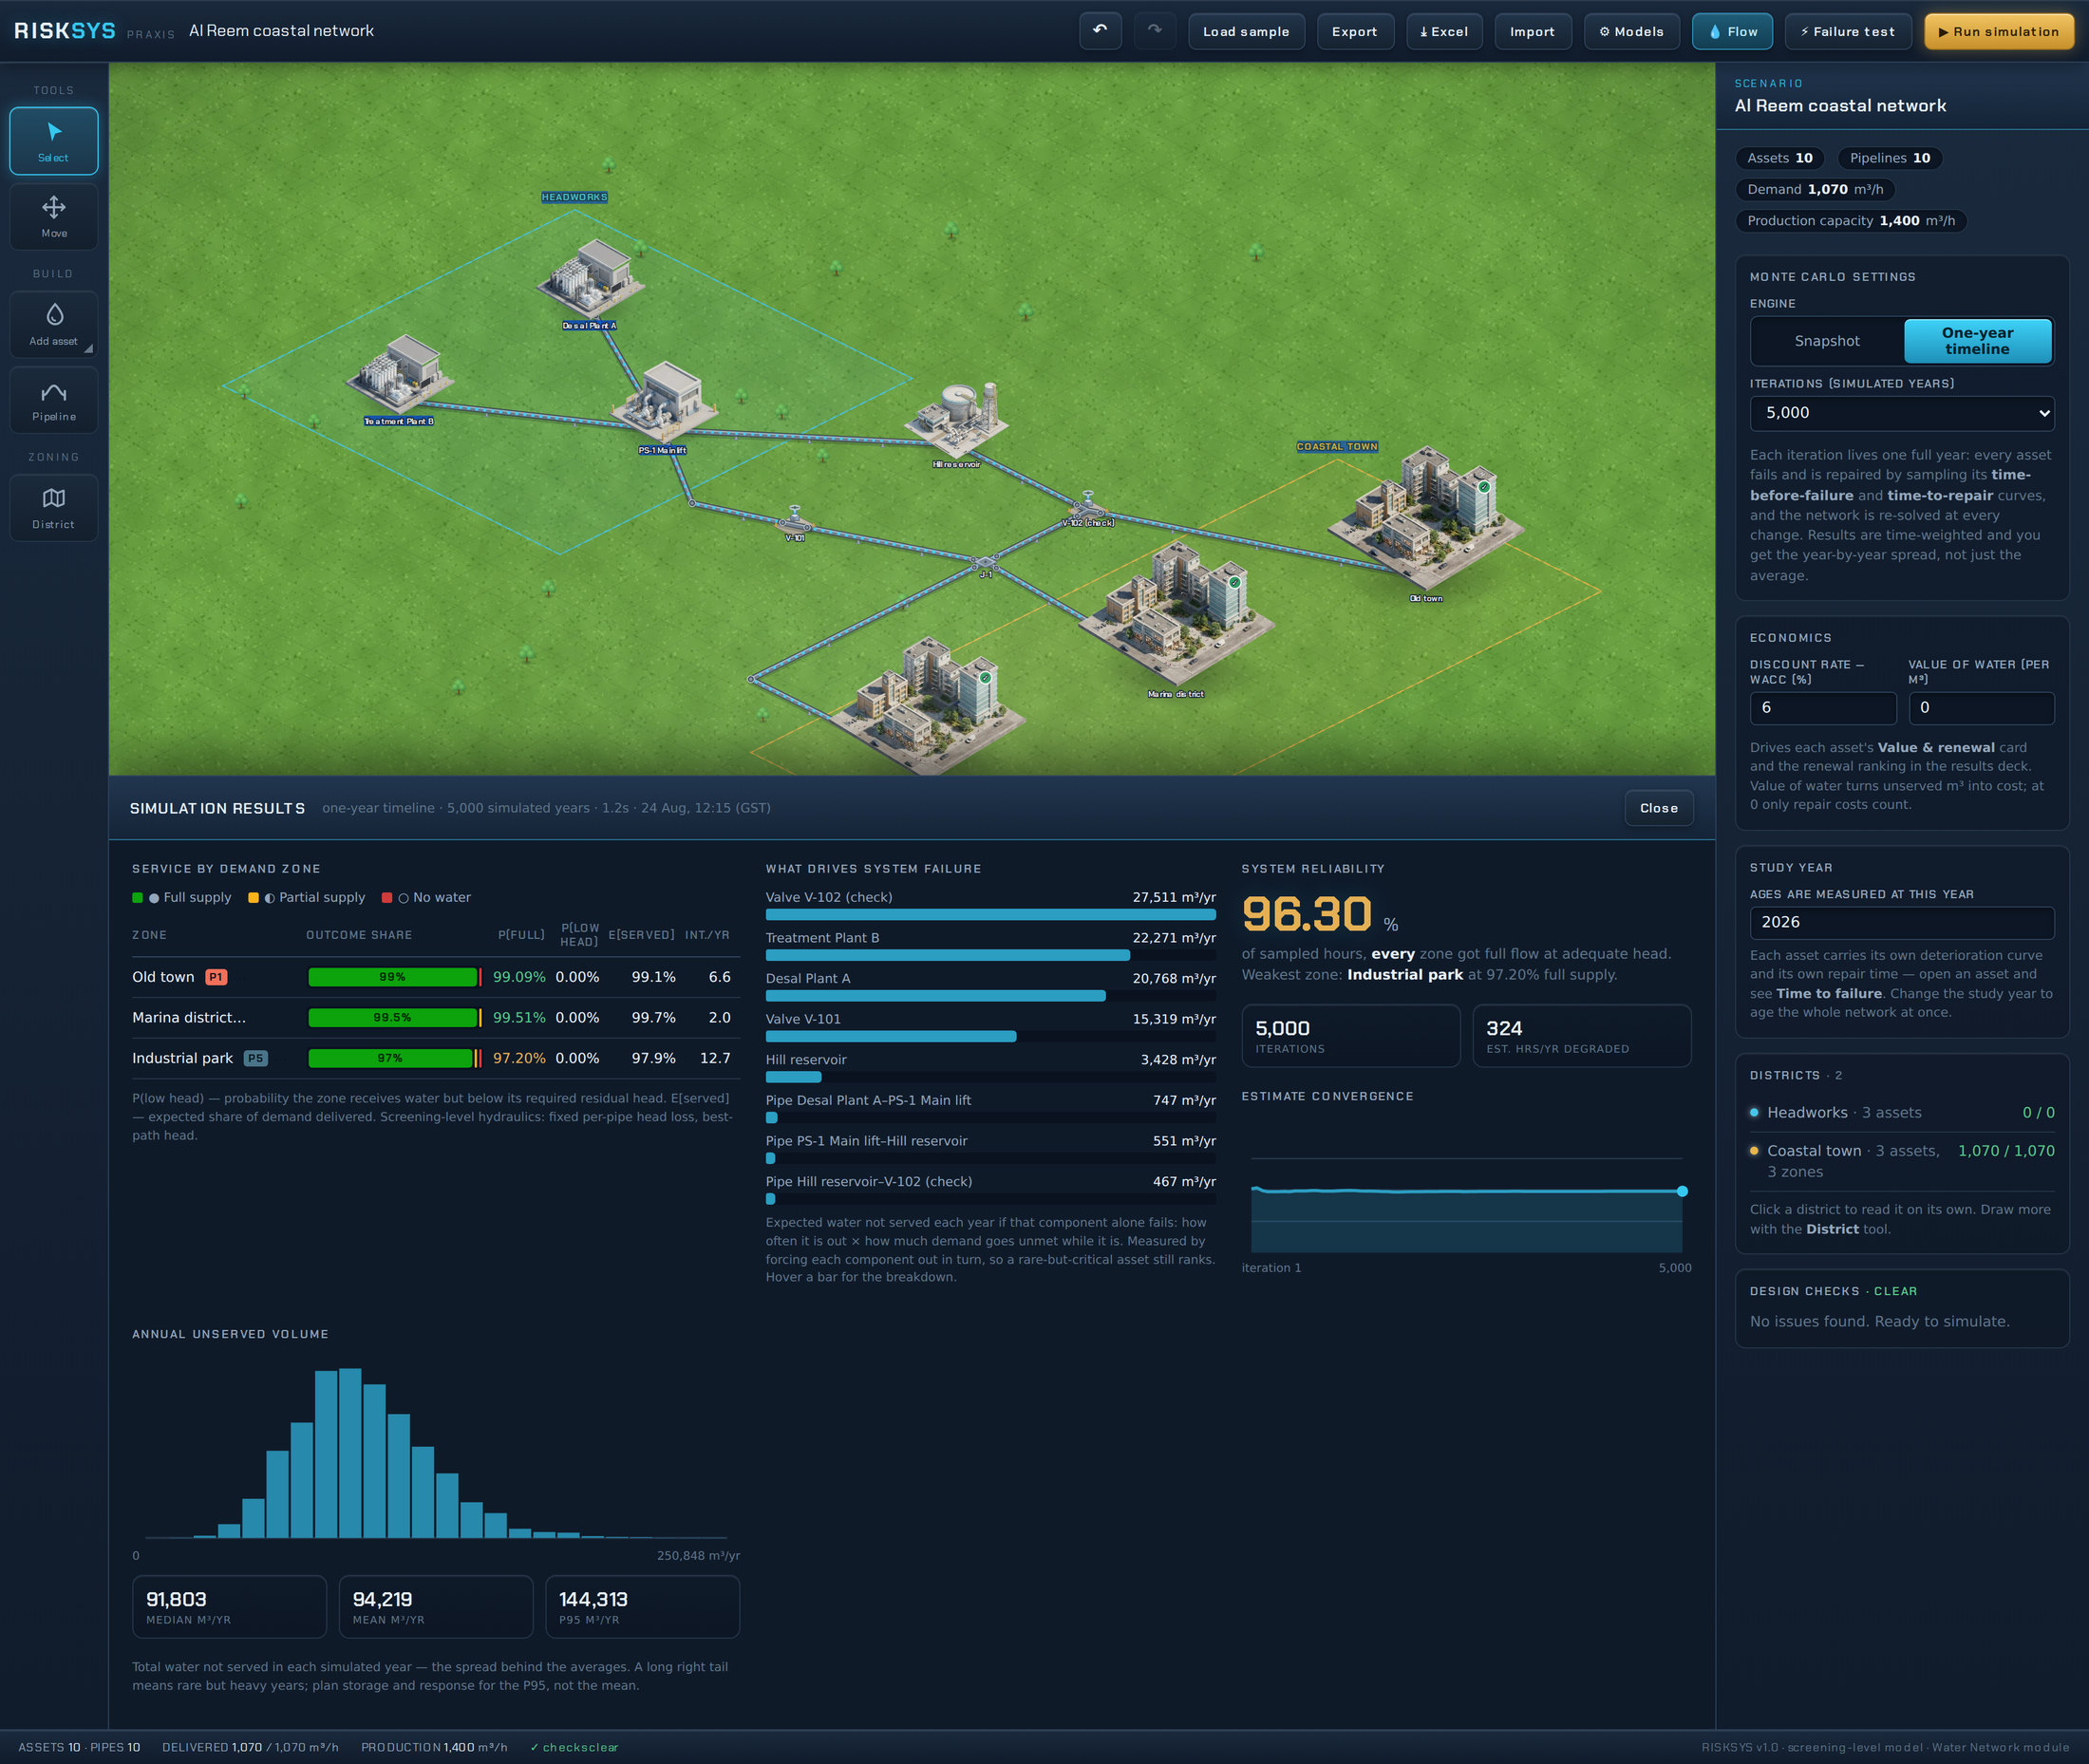
- Service by demand zone. For each zone, the share of the year it gets full supply, the share it gets water below the head it needs, the expected share of demand delivered and the number of interruptions a year.
- What drives system failure. Every asset and every pipeline ranked by the water not served each year if that component alone fails, so a rare failure with a large consequence still ranks.
- System reliability. The share of sampled hours in which every zone got full flow at adequate head, with the weakest zone named.
- Annual unserved volume. The whole distribution across simulated years, with its median, mean and P95 — so the rare heavy year you have to hold storage against is visible, not buried in an average.
- Renewal priority. Assets ranked by what replacing them buys, against their capital cost and your discount rate.
- Estimate convergence. The result plotted against iteration count, so you can see the answer settle instead of taking it on trust.
- Failure test. Force any set of assets out by hand and watch supply redistribute immediately, before running any statistics.
- Export to Excel. The scenario and its results, so the numbers can be checked and carried into a business case.
An asset is not a single number.
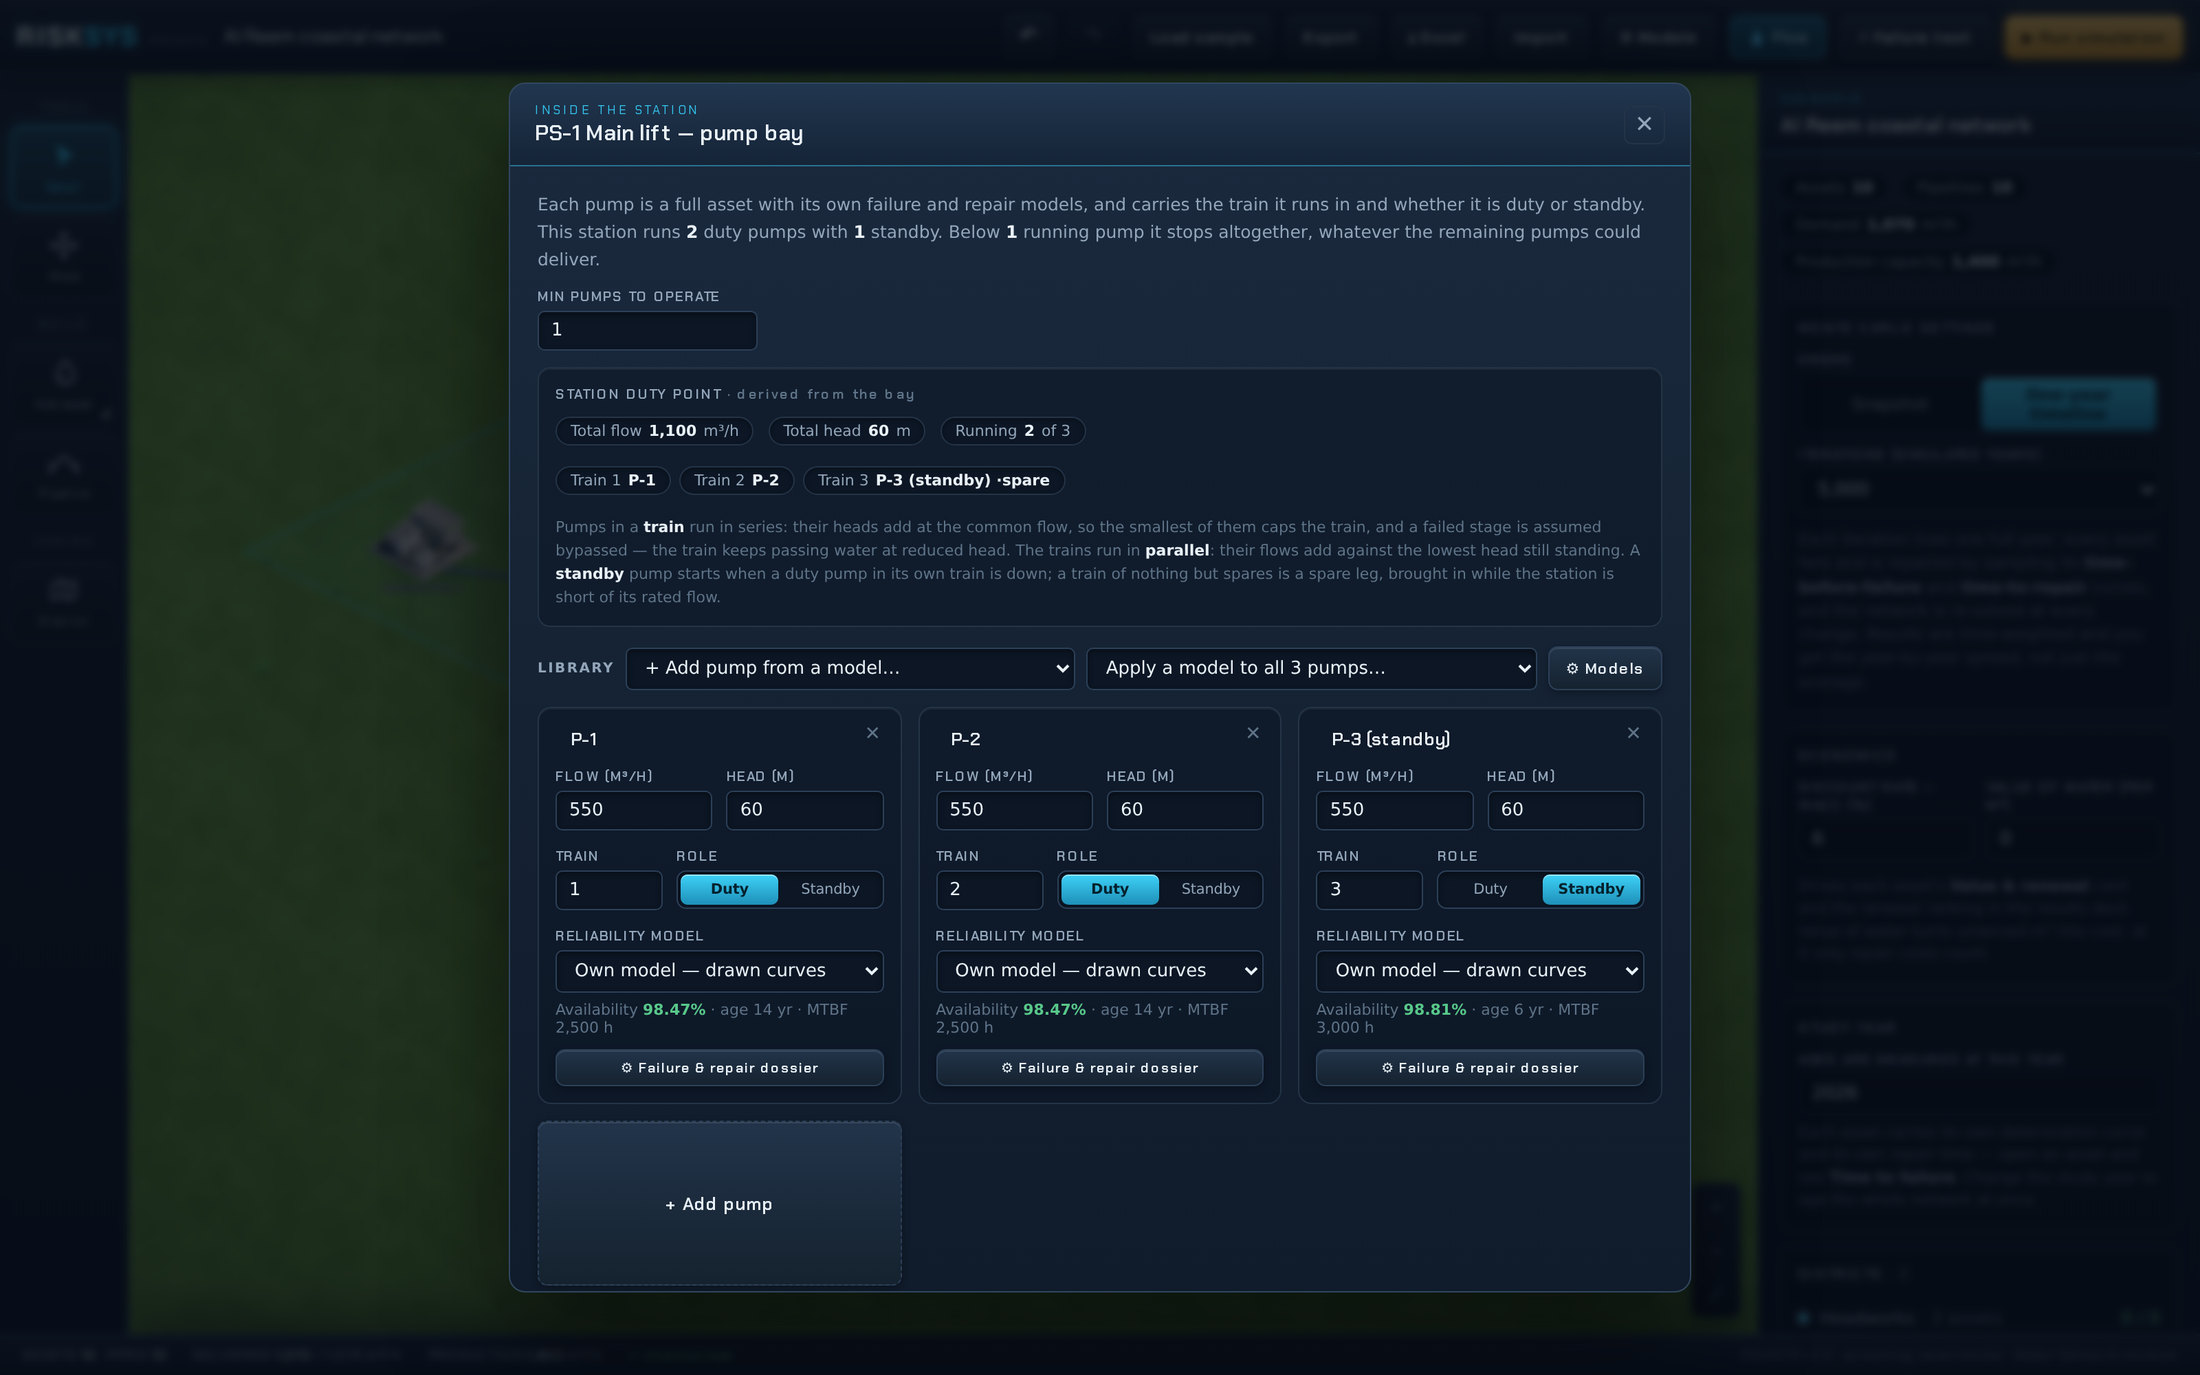
A pumping station is a bay of pumps. Each pump is a full asset with its own failure and repair curves, sitting in a train, running as duty or standby. Pumps in a train run in series and their heads add; the trains run in parallel and their flows add. Set how few pumps the station can run on and the model works out the rest.
The same applies down the network. A pipeline's break rate comes from its diameter, material, joint type and age. A demand zone carries a priority, and when there is not enough water to go round the model serves the critical zones first without ever changing the total delivered.
Reliability models can be kept in a library and applied across the network, so a fleet of identical pumps is described once rather than fifty times.
What it is, and what it is not.
RISKSYS is a screening-level model. The hydraulics are deliberately simple: each pipe carries a design head loss, flow is routed along the least-lossy path, and pressure is reported as a check on whether a zone is being served at adequate head. That is enough to rank assets and to size the problem. It is not a replacement for a calibrated hydraulic model, and it does not pretend to be one.
What it does that a hydraulic model does not is put reliability and consequence on the same page. EPANET or WaterGEMS will tell you what happens when a main is out. RISKSYS tells you how often that main is out, what it costs when it is, and whether fixing it is worth more than fixing the pump upstream.
The current release is the water network module. The engine underneath it is not specific to water, and we are interested in hearing which network an operator would want modelled next.
RISKSYS is one of three.
RISKSYS stands on its own and needs nothing else to run. It is worth more beside a register that already knows the age and condition of every asset in it.
Keystone Asset
The hosted asset management system: asset register, work orders, maintenance planning, spare parts, fuel and cost reporting, aligned to ISO 55000. It holds the record RISKSYS reasons about, and it takes the renewal priority back as planned work.
About Keystone AssetKeystone Horizon
Asset investment planning. Horizon takes remaining life and criticality out to a long horizon and turns them into multi-year budget scenarios and renewal cases that boards and regulators can follow back to the asset data.
About Keystone HorizonFurther reading: Criticality should come out of the model, not go into it · Monte Carlo simulation in quantitative risk analysis
Open it and build something.
The studio runs in the browser with a sample network loaded, and nothing you draw leaves your machine. If you would rather we built your network with you, write to sales@praxisam.com.