Almost every utility we work with has a criticality register. An engineer has scored each asset from one to five on the consequence of its failure and from one to five on its likelihood, the two scores are multiplied, and the product decides where the renewal budget goes. It is a sensible way to start. It is a poor way to finish, and the reason is structural rather than a matter of how carefully the scoring was done.
A network does not fail one asset at a time
Scoring asks about assets one at a time. A network does not fail one at a time. A duplicated pump that scores high on its own may not matter at all, because the standby carries the flow. A small valve that scores low may be the one thing standing between a district and a dry morning, because everything downstream of it has no second path. The difference is not in the asset. It is in where the asset sits and what else can carry the water when it goes.
No amount of care in the one-to-five scoring recovers that information, because the information is not in the asset. It is in the topology.
Turning the question around
Keystone RISKSYS works the other way round. You draw the network as it is actually built — production plants, pumping stations, storage, valves and the mains between them — and describe how each component ages, fails and is repaired. The model then knocks each component out in turn, re-solves the whole network, and measures what that costs in water not delivered. Criticality comes out of the model rather than going into it.
Because the failure and repair behaviour of each asset is a curve rather than a single score, the model can then live the network forward through thousands of simulated years. Assets fail and are repaired on their own curves, the network is re-solved at every change, and each demand zone accumulates a record of how much of each year it got full supply, low pressure, a shortfall or nothing.
Three things that fall out of doing it this way
Rare but severe failures keep their rank. A component that fails once a decade but leaves a hospital dry when it does ranks above one that trips every month with a standby to cover it. In a scored register those two often come out level.
The heavy year is visible. The annual volume of unserved water comes out as a distribution, not an average. The median tells you what a normal year looks like; the P95 tells you what you have to hold storage against. Planning storage on the average year is how utilities end up surprised by a year that the model would have shown them.
Renewal becomes a comparison, not a list. Each candidate asset is ranked by the reduction in unserved water that replacing it buys, against its capital cost and the discount rate. That is the number a business case needs and the number a scored register cannot produce.
Modelling a station as it is built
The detail that matters most in practice is the pumping station. It is not one asset with one failure rate; it is a bay of pumps, each with its own curves, arranged in trains as duty and standby. Pumps in a train run in series and their heads add; the trains run in parallel and their flows add. Tell the model how few pumps the station can run on and it works out the station’s reliability from the pumps’, which is where the redundancy the scored register could not see actually lives.
The same logic applies down the network. A pipeline’s break rate comes from its diameter, material, joint type and age. A demand zone carries a priority — critical, essential, normal, low, deferrable — and when there is not enough water to go round the model serves the critical zones first, wherever they sit on the map, so the result reflects the operating rule rather than an accident of the max-flow solver.
What it is not
The hydraulics are screening-level, deliberately. Head loss along a main is a figure the engineer enters, and pressure is estimated along the best path. This is not a hydraulic model and it is not trying to be one. The question it answers is “where does this network break and which asset dominates the risk”, not “what is the pressure at node 47 at three in the morning”. For the renewal decision, the first question is the one that has been going unanswered.
Where to start
A first network takes an afternoon in a browser: a handful of plants and stations, the trunk mains, the zones that matter. Run the failure test by hand before running any statistics — force a station out and watch where supply redistributes. Engineers who have carried a criticality register in their heads for years usually find the first surprise within the hour, and it is rarely the asset they expected.
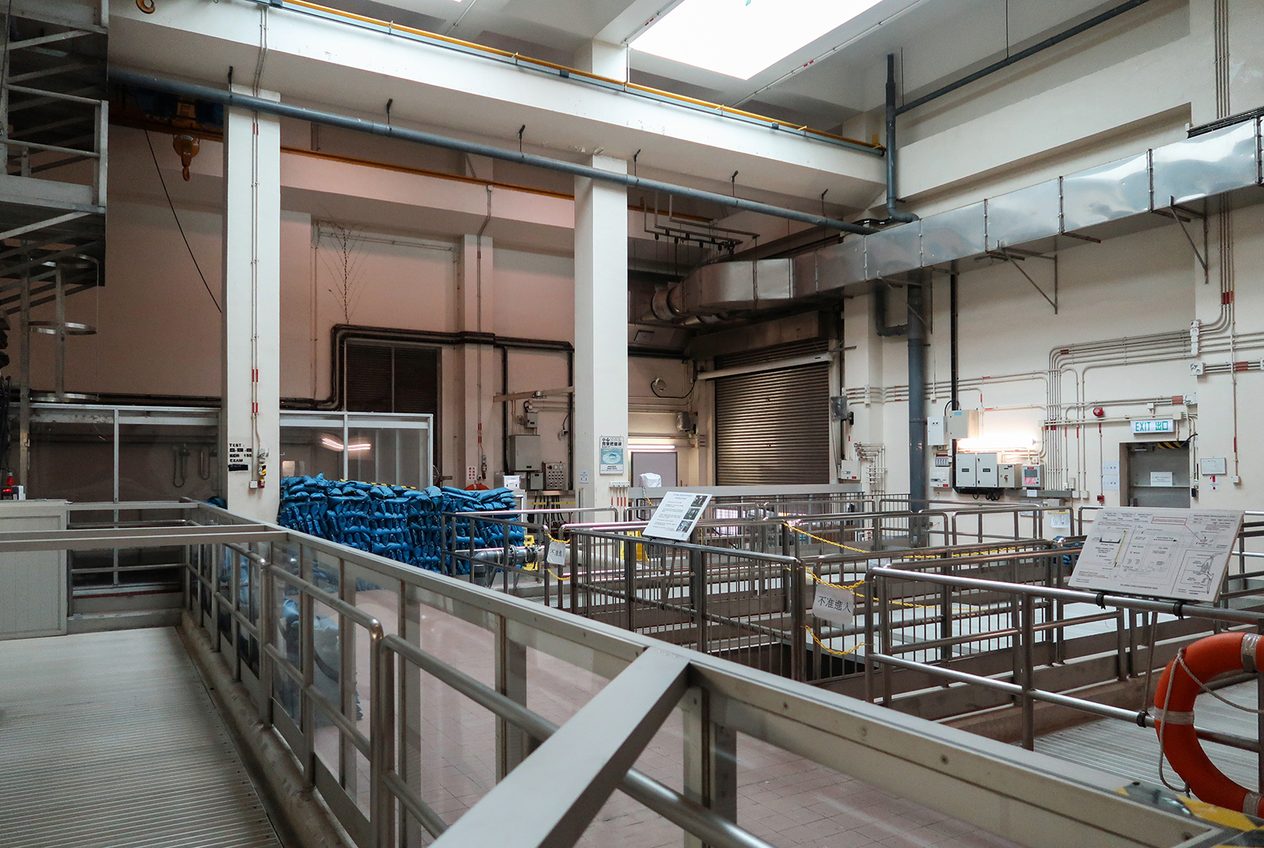
Images: Pipeline in the Mojave Desert, California by PHMSA, Public domain, via Wikimedia Commons; Tai Hang Tung Flood Storage Flood water pumping station interior 2018 by Wpcpey, CC BY-SA 4.0, via Wikimedia Commons.